Services
Data, reports & forecasting
Stop rebuilding the same report every week, and start deciding from numbers that update on their own.
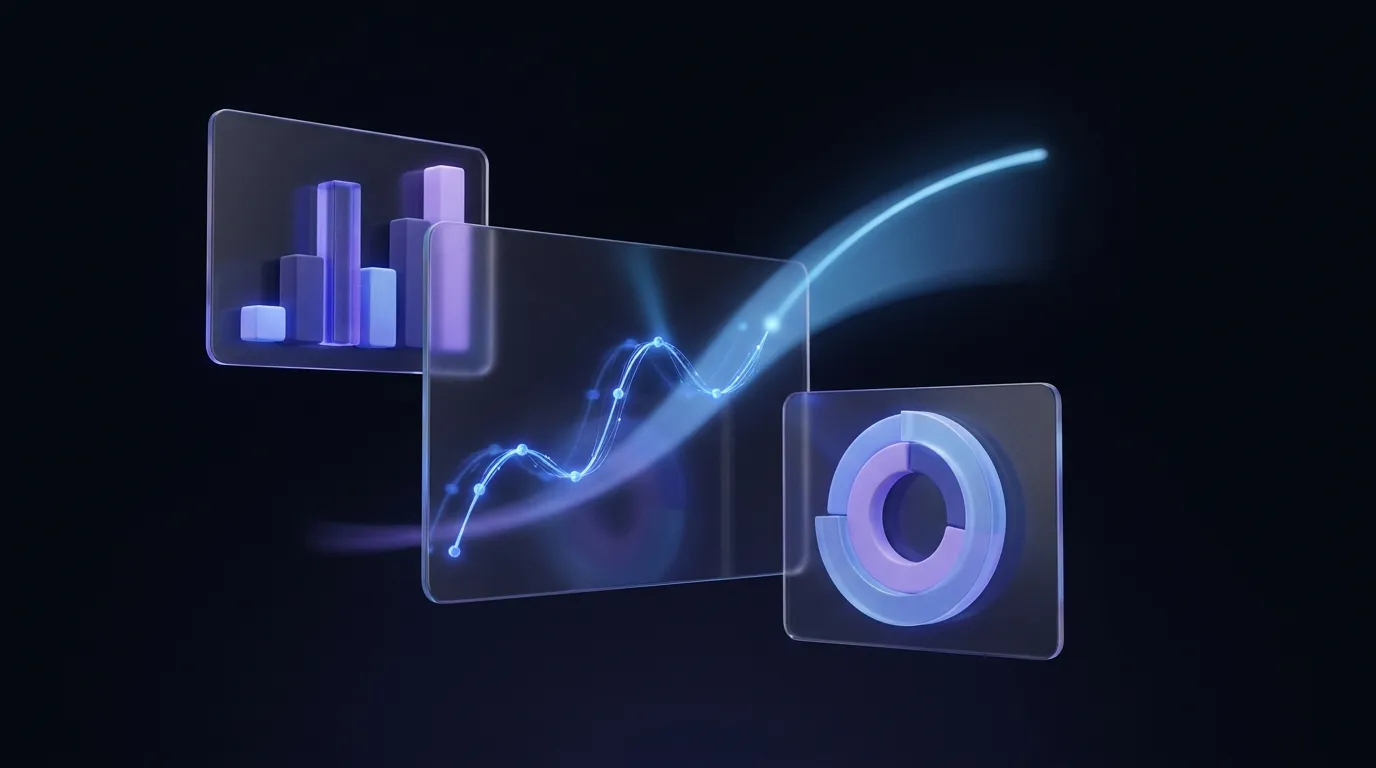
In most businesses the data already exists — in accounting, in the order system, in files from suppliers. What's missing is one place that connects them and shows what matters. I build dashboards, automatic reports and forecasts on your real data, with alerts when something is off.
What usually hurts
Manual reports
Every month-end someone copies data into Excel, fixes it and sends it. By the time it's ready, it's out of date.
No single source of truth
Sales says one number, accounting says another. Without one source, every meeting starts with an argument about the numbers.
Problems found too late
A price deviation, a stock-out or a supplier price hike only shows up when it's too late to fix.
What's included
- 01
Dashboards and KPIs
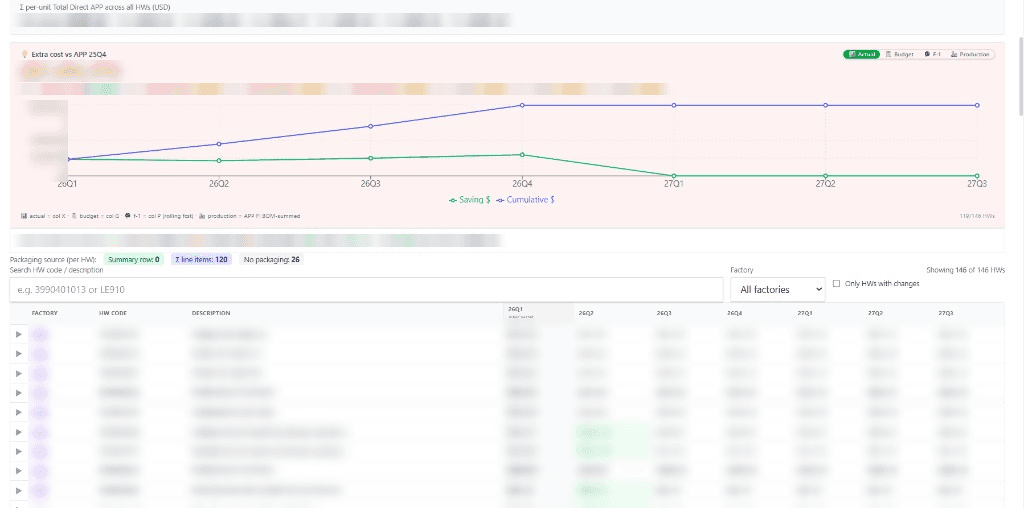
The metrics that matter on one screen, filtered by period, customer, product or rep.
- 02
Automatic file intake
Excel and CSV files from suppliers and systems are imported, cleaned and merged on their own.
- 03
Reports that send themselves
A weekly or monthly report in your inbox, or one-click Excel export.
- 04
Forecasts
Cost, sales or stock forecasts from your history, showing where each number comes from.
- 05
Audits and alerts
Checks for price and data deviations, with an alert when something looks wrong.
- 06
Questions in plain language
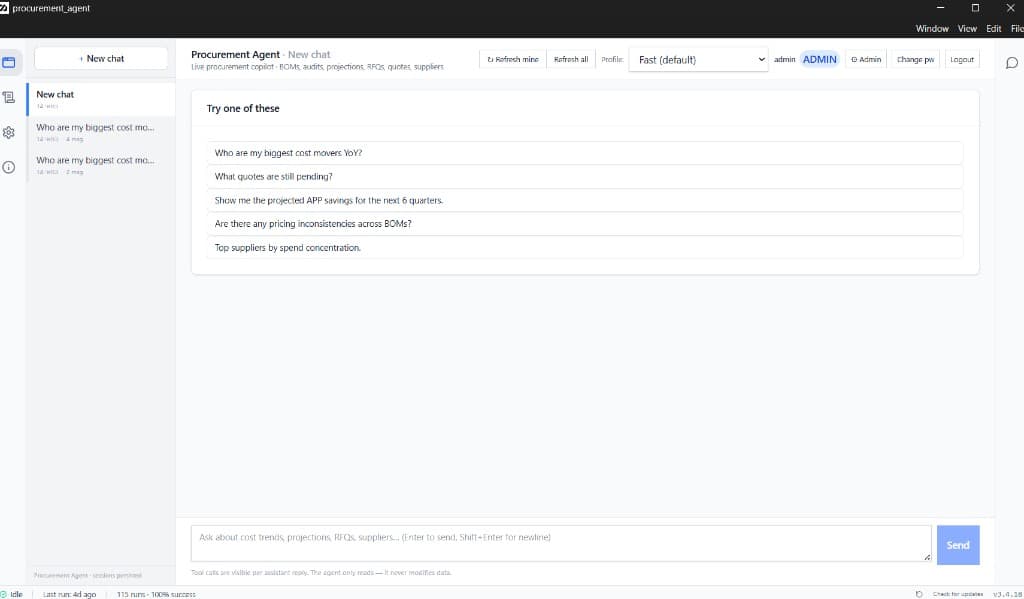
Ask your data a question in plain words and get a grounded answer, no queries needed.
How it works
What you want to know
We start from the decisions you make, not from the data. Which questions should the dashboard answer?
Map the sources
Find where each number lives, how reliable it is, and how to pull it automatically.
Clean and merge
Build a layer that unifies the data and fixes duplicates and gaps.
Dashboards and reports
Build the screens and reports, and check together that the numbers match what you know.
Forecasts and alerts
Once the base is solid, add forecasts and checks that warn you ahead of time.
Projects
Questions about this service
More questions? Read the FAQ
Do we need to replace our systems?
No. The dashboard connects to what you already have — accounting, orders, files — and pulls the data from there.
How is this different from Power BI or Looker?
Those tools are great when someone maintains them. I build a custom solution when you need complex file intake, unique business logic, or screens that non-technical people use every day.
How accurate are the forecasts?
A forecast is only as good as its data. Each forecast shows what it's based on, and we check it against actual results over time.
Is our data secure?
Yes. Data stays in your accounts, access is limited by role, and AI tools only get read access.
Other services
- Business systemsCustom CRM, ERP/MRP, orders and inventory
- Web & mobile appsiOS, Android and web — from prototype to production
- AI agents & automationWhatsApp bots, smart assistants and automated workflows
- IntegrationsAccounting, stores, marketplaces, email and calendar — connected
- Websites & platformsFast sites with a CMS your team runs on its own
- Online storesShopify stores and online ordering built to sell
Contact
Have a system or app in mind? Let's talk.
Tell me what your team needs and I'll tell you how I'd build it. Call, message me on WhatsApp, or send an email.
+972 50-488-8987